Coronavirus 2020 Outbreak

The news have been worrying — this year’s deadly / scary virus (which likely started in a Wuhan seafood market) claims more and more victims all around the globe. Since yesterday there’s also at least one confirmed case in Germany. I am not an epidemiologist, but I took the liberty to look at the data from a pure data analyst’s perspective — and the results have been shocking.
Exponential growth
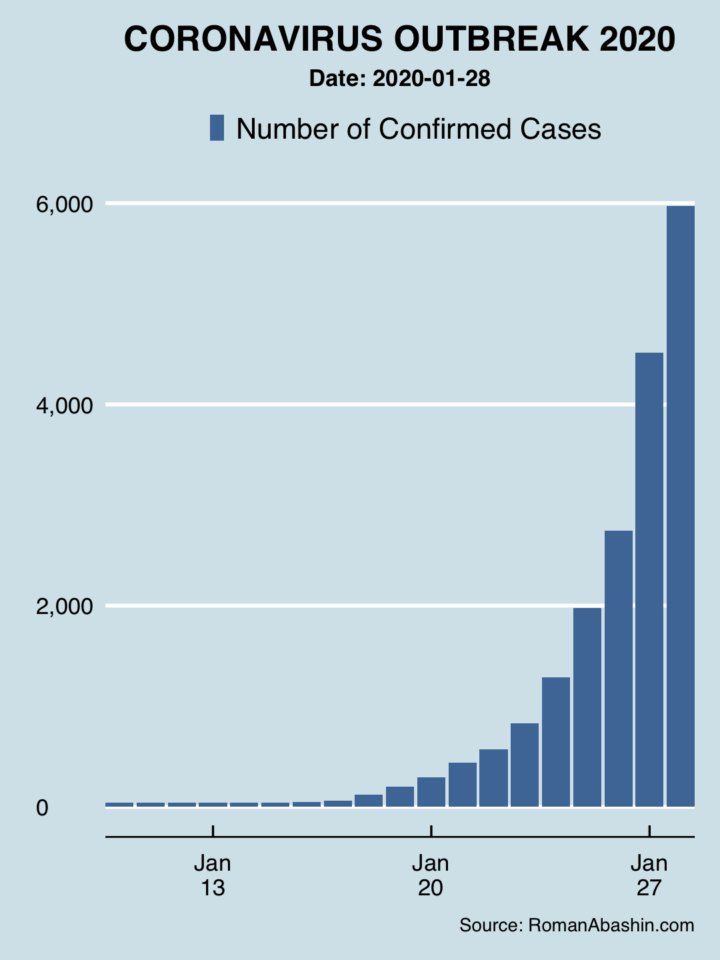
After an unclear situation in the beginning of 2020 the coronavirus confirmed cases have grown rapidly — from 41 confirmed cases on Jan 10 to almost 6,000 cases on Jan 28. This is an exponential growth that, from a data perspective, looks quite worrying. Again, I am not an epidemiologist or medical professional, so this way of thinking is probably over simplistic. Nonetheless, let’s visualize the number of confirmed coronavirus cases up until Jan 28:

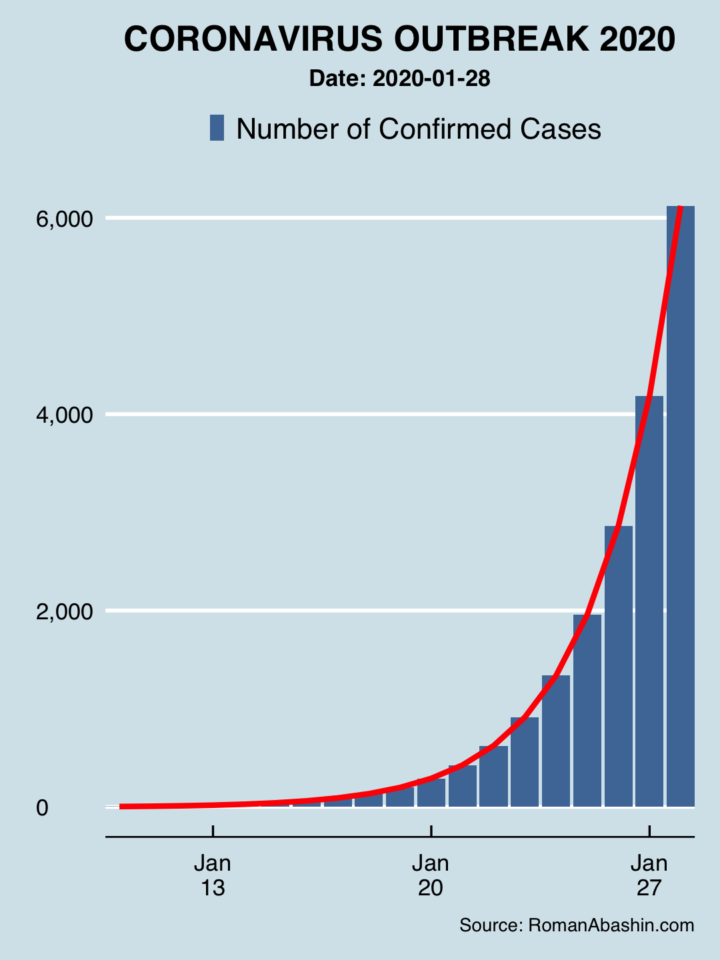
Now let’s try to fit a statistical linear model to the actual data. I will write at some other about about the approach. Let’s see what happens:

Prediction for February
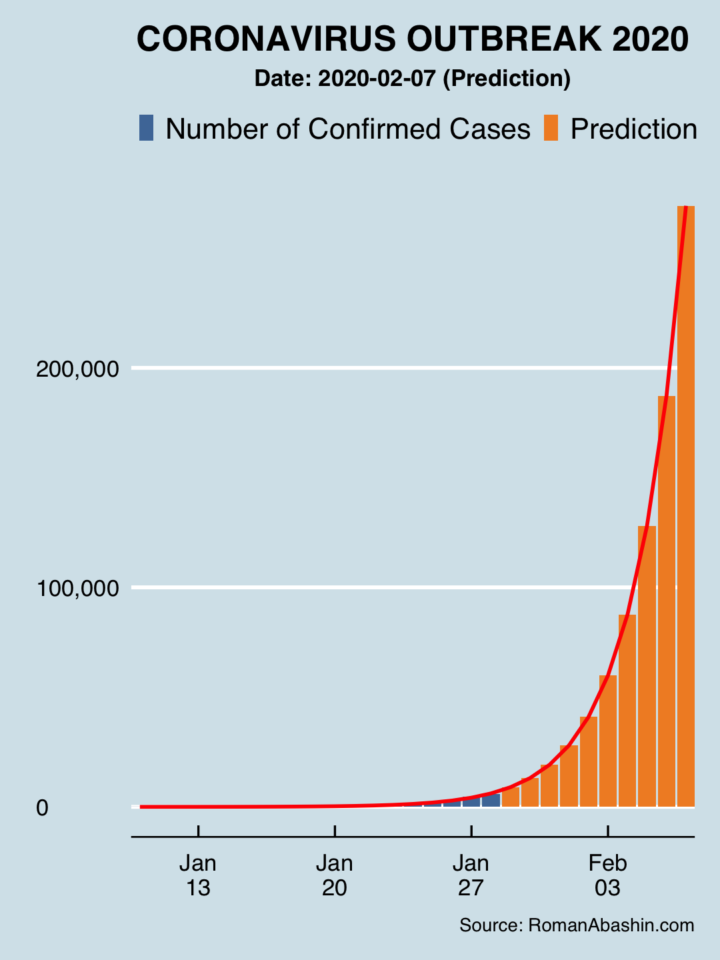
So what does this mean going forward? If we were to predict the number of confirmed coronavirus cases from the data alone, we can use above linear model to interpolate the data for the next, let’s say 10 days.

This is, honestly, worrying. If the international efforts to contain the virus should fail and it in fact shows exponential growth of infection, we could see cases in the six digits as soon as in the beginning of February.
Member discussion