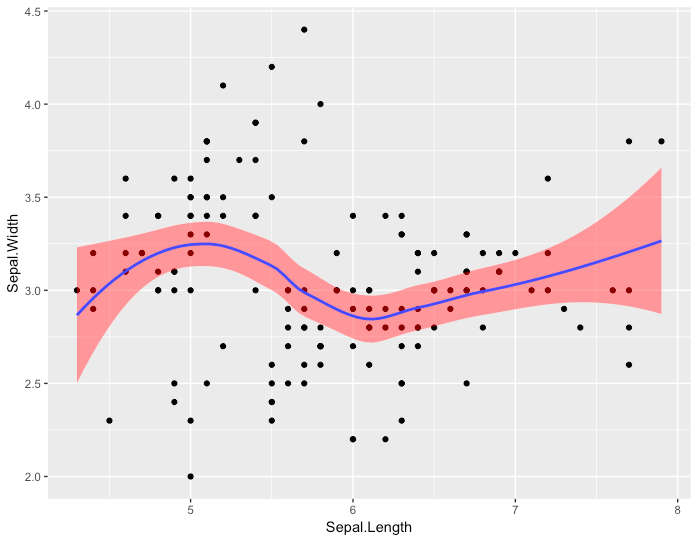
How to set the color of the confidence interval (se) of geom_smooth in ggplot2
Use geom_smooth(fill = "red").
ggplot(
    iris,
    aes(
        x = Sepal.Length,
        y = Sepal.Width
    )
) +
    geom_point() +
    geom_smooth(fill = "red")

Member discussion